
Economic Trends 2000-2020
by Dirk Bol
March 2021
Introduction
In this paper I intend to review Africa’s economic progress since the year 2000, so two decades. When I say Africa I mean Sub-Saharan Africa (SSA), 47 to 49 countries excluding the five North African ones (but including Somalia without data and South Sudan with little data). Africa (SSA) today accounts for around 14% of the world’s population, but only about 2% of global GDP.
In the first part I review data with respect to the economic development of the continent during the last two decades, 2000-2020, with respect to economic growth, poverty, and the structure of the economy. This overview ends at the end of 2019, so does not include the corona crisis nor locust plague or other calamities (ethnic confict Ethiopia, ISIS in Sahel, Nigeria and Mozambique a.o) . In the second part I will try to highlight successful developments and possibly draw some lessons for the future.
A few sources are presented in the text, and at the end, but most figures are readily available at the internet, from the World Bank (world development indicators), the IMF and African Development Bank ’s outlooks.
Population and Economy
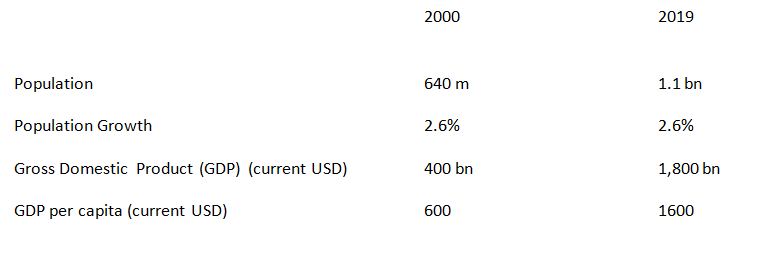
The first table shows the population changes since 2000, an increase of 70%, and of that of the Gross Domestic Product (GDP), an increase of 350%. Unfortunately, there is hardly any reduction in population growth since 2000, yet the per capita income (GDP) increased by over 150%.
GDP measures the total value of the annual production of goods and services within the given borders, in fact the value added (output minus input). This includes a lot of guesswork for the informal (urban)sector and the agricultural subsistence one. Regular surveys are being undertaken to improve estimates, with a firm basis in household (budget) surveys, of which every country now has at least two comparable ones over time, but with almost half of the countries not having a recent Population Census (since 2009). Regular Demographic Health surveys are also a useful source of information. Re-calculations of GDP, taking a new base year for comparison, introducing new modern sectors and getting a better grip on informal sectors, can lead to substantial increases of the present GDP, e.g. over 100% increases for Ethiopia, Ghana and Nigeria, and 25% for Kenya. Such revaluations contribute to necessary statistical reforms. [1] Unless mentioned otherwise, current US dollars are used for calculations, and not international or other dollars that reflect the purchasing power parity (PPP), or constant prices.
Basic Indicators

Population and economy are distributed very unevenly on the continent. The following table shows the shares of the major countries in the total population and the total economy (GDP) (adapted from Bol, 2014)
Population and GDP share per country for 2019
| Country | Population share % | Country | GDP share % |
| Nigeria | 18 | Nigeria | 25 |
| Ethiopia | 10 | South Africa | 21 |
| DRC | 8 | Kenya | 5 |
| Tanzania | 5 | Angola | 5 |
| South Africa | 5 | Ethiopia | 5 |
| Kenya | 4 | Ghana | 4 |
| Sudan | 4 | Tanzania | 3 |
| Uganda | 3 | DRC | 3 |
| Mozambique | 2 | Cote d’Ivoire | 3 |
| Ghana | 2 | Cameroon | 2 |
Only four countries contain 40% of Africa’s population, with 60% in the ten countries shown in the table. On the other hand, about ten countries have one million or less people. No wonder that population density varies enormously, with 400 (people per sq. km) in Rwanda and 10 in the Sahel, and an average of 40.
An even higher concentration is visiblein the economy, with the two largest economies producing almost half of the total GDP. The ten largest economies are good for three quarter of the total. A high population is important in this respect, but also a relatively high per capita income.
Two countries are officially rich by now, Seychelles and Mauritius, with per capita income(GDP) of more than $10.000. Five countries have a p.c. GDP between $5000 and $ 10.000: Equatorial Guinea, Gabon, South Africa, Botswana and Namibia. Together with 18 other countries these are now the so-called middle income countries, with p.c. income over $1000. One can distinguish amongst them the so-called mature ones (like Botswana, South Africa and Mauritius),with a rather balanced and diversified economy, the commodity ones (like Angola, Nigeria, Ghana and Zambia), relying very much on a few commodities like oil, gas and minerals, and the new ones (like Cameroon, Cote d’Ivoire and Senegal) (World Bank, Mc Kinsey).
At the bottom we find another 21 countries, the so-called low-income countries, with p.c. income below $1000. Seven of these still have a p.c. GDP below $500: DRC, Mozambique, Madagascar, Niger, CAR, Burundi and South Sudan. Almost half of the African population still lives in a low-income country.[2]
Economic Growth
During the period 2000-2020 economic growth in Africa, that is of real – inflation corrected – GDP, averaged almost 5% per year, certainly unti 2015, after which a slight decline occurred (closer to 3%) due to lower commodity prices. Exporters of oil, metals and minerals suffered, not the other countries. This makes it the second fastest growing region in the World after (East-)Asia. Within Africa East-Africa performed best,with growth over 6%, followed by West-Africa, Central and Southern Africa. But in fact, growth has been present throughout the continent, with over one-third of African countries posting close to 6% growth rates, and another 40% growing between 4% to 6% per yea r.
Ethiopia is on top of the list, even in the world, with growth reaching 10% since 2010. A number of other economies, like Rwanda, Tanzania, Kenya, Ghana and Cote d’Ivoire, grew close to 6% (annually),with DRC, Mozambiqe, Niger and Burkina Faso reaching almost 5% (since 2010).
Due to all this economic growth a number of countries will soon reach the status of middle income country, like Ethiopia, Kenya, Rwanda, Mozambique, Sierra Leone and Chad. General fundamentals of economic growth are also improving, with a gradual shift from private consumption toward investment and exports. For the first time in a decade, investment accounted for more than half the continent’s growth, with private consumption accounting for less than one third (World Bank 2019).
Natural resources (oil , metals, minerals) have been responsible for 30% of Africa’s growth (Goldman Sachs 2019), largely through exports. But most of Africa’s growth has been in the sectors that largely serve domestic markets (Diao and McMillan).
Commodities (fuel, minerals and unprocessed agricultural products) represent the biggest share of African exports (World Bank, 2019). The top five exports of SSA countries, consisting of non-renewable natural resources, accounted for 60% of all exports around 2015. These are petroleum, iron ore, bituminous minerals, gold and natural gas. Many countries in Africa are endowed with natural resources, 17 are now resource-rich, of which eight oil exporters and nine exporters of metals and minerals. Overall, sub-Saharan African manufacturing exports almost tripled between 2005 and 2015, to more than $140 billion. Yet in 2019 three quarters of Africa’s exports were still primary (unprocessed) goods, with oil good for 40%, whilst imports of manufactured goods were three times more than its exports of such products (Unctad 2020).
A reduced reliance on the traditional OECD market is also clearly visible, with China and India now absorbing a major portion of African exports.
Trends in foreign aid: Net official development assistance increased from $ 12bn in 2000 to $ 44bn in 2018. As a percentage of imports this decreased from 10 to 8%. As a percentage of GDP aid declined from 3 to 2.5%. Per capita aid increased from $18 to $41. China is now the top donor, before USA and European countries. Ethiopia is thelargest recipient of aid, followed by Nigeria, Kenya and Tanzania.
Foreign investment and remittances (by migrants) each were slightly higher than the foreign aid in recent years. Still, a growing number of countries (18 in 2018) risked a debt crisis, with aggregate debt-to-GDP ratio doubling in ten years (to 46% in 2017).
Poverty
Per capita incomes (real) have been growing at over 2% annually for the last 20 years, which is good in view of a stubborn population growth (of 2.6%). And it is a remarkable break with the past, as real GDP p.c. in 2000 was 20% below the 1980 level (Milanovic). In that sense the new milennium has completely changed the oulook for Africa. The region’s per capita GDP increased between 2000 and 2014 by almost 35 per cent in real terms, doubling in some countries[3] Only in 10 countries economic growth could not keep up with population increases. But recent economic growth rates of around 4% on average are below the 7% Sustainable Development Goals target (UN), which are also needed to significantly reduce poverty in the continent. Despite all the economic growth the poverty share, i.e. people living below the poverty line of $1.9 p.p.p.d., declined only from around 50% of the population in the 1990s to roughly 40 per cent recently (2015).[4] The absolute number of poor hardly changed and remains close to 400m people.
Although inflation is excluded from official growth figures, as these are in real inflation-corrected terms, this does hinder poor people in particular in real life, as cost of living increases are not quickly compensated for in earnings.
Between countries there are vast differences. Around ten of them still have more than half of its population classified as officially poor, e.g. DRC, Burundi, Rwanda, Mozambique, Madagascar, Malawi and Zambia. But the situation is improving in Rwanda, Mozambique and Malawi. In another ten coutries less than 25% of the population is still poor, e.g. Botswana, Cameroon, Ghana, South Africa, Gabon and Cape Verde. This means that the vast majority (30 countries) are in the middle.
Between 2000-2015 the highest poverty reduction rates were observed in Tanzania , Chad, Congo , Burkina Faso , DRC, Ethiopia and Namibia (World Bank 2019). Poverty almost halved in Ethiopia in the last 20 years (now at 27%).
Economic growth is a necessary condition for poverty reduction, but not a sufficient one. Much economic growth in Africa has been less than inclusive. Only about a third of its countries achieved pro-poor inclusive growth, reducing both poverty and inequality (ADB Outlook 2020). Roughly three groups can be distinguished, based on experience over the past ten to 15 years or more (UN-Wider, 2018). Countries categorized within the first group, relatively rapid growth and corresponding poverty reduction, are: Ethiopia, Ghana, Malawi, Rwanda, and Uganda. Countries categorized within the second group, relatively rapid growth but limited poverty reduction, are: Burkina Faso, Mozambique, Nigeria, Tanzania, and Zambia. Countries categorized within the third group, uninspiring or negative growth and corresponding relative stagnation or increases in poverty, are: Cameroon, Côte d’Ivoire, Kenya, Madagascar, and South Africa. DRC and Madagascar are the only countries where its p.c. GDP is now lower than what it was before its independence (Milanovic). In 2020 still six African countries had a p.c. GDP below $ 500 (Statista). In six countries there had been a negative real growth of GDP p.c. during 2000-2016,whilst in 14 countries agricultural growth had been below population growth (Jayne).
Historically poverty in SSA responds less to economic growth than elsewhere. Reasons for this are a high population growth, institutional fragility and conflicts, and high inequality.With a Gini coefficient of 0.43 (0 meaning total equality, 1 meaning total inequality), Africa is one of the most unequal regions. South Africa show the worst income distribution, with a Gini of 0.60, compared to a figure of 0.28 in the most equal country Ethiopia’s lowest figure of 0.28. But Gini coefficients are hard to measure accurately, certainly regularly, and such calculations usually exclude informal redistribution, within extended famlilies, of which there is still much in Africa (World Bank, 2018, GapMinder; the Gini coefficient in the Netherlands in 2019 was 0.28). Poverty thus far remains largely a rural phenomenon, and one of little education. Within households women and children are often less well off than men.
Of course, poverty is a complex matter, going beyond pure economics, although average incomes are correlated with self-reported satisfaction with standards of living and happiness scores, not perfectly however[5] .But UNDP developed a multidimensional poverty index (MPI), with health and education indicators, as well as standard of living aspects (housing, water). The average MPI for Africa is 57, meaning that 57% of its population still experiences multidimensional poverty, with a variation from 6 % in South Africa to 91% in South Sudan. Within countries there are also vast diffences, e.g. an average 55 for Uganda hides 6% in Kampala and over 90% in some rural areas (Karamoja). The fact that other poverty dimensions often lag behind income increases is clearly visible in Ethiopia, with an MPI of 49, much higher than the monetary poverty rate of 27%. Eight of the country’s 11 regions saw a significant reduction in the incidence of multidimensional poverty, Addis Ababa nearly halving that rate to 15%, but in some this is still very high (Somali 91%). On the other hand, in some countries overal poverty reduction precedes monetary one, as in Rwanda with a much lower MPI (0.26, i.e. 26%) than its monetary poverty rate (55%). South Sudan, Chad, and Niger score worst in this respect, with 90% of its population still in non-monetary poverty.
Finally, trends in social indicators during the period 2000-2020 are positive. Life expectancy (at birth) increased from 52 to 63 years during 2000-2018, from 49 to 59 for men and from 52 to 63 for women. Infant mortality rates declined from 92 to 53 (per 1000), slightly higher for boys than for girls. Primary school (net) enrollment increased from 60 to 78%, and secondary school (net) enrollment from 21 to 36%, with girls rapidly closing the gap with boys. Of course, figures per country differ, e.g. Life expectancy is 69 years in Ethiopia and Rwanda, but only 62 in Burundi and Mali.
The structure of the economy
The economic structure differentiates between three broad sectors, agriculture, industry and services, and looks at the relative share of each value added in GDP. Agriculture usually includes forestry and fisheries, industry lumping together mining (oil, metals and minerals) and quarrying, manufacturing, construction, electricity, gas and water, while the services sector combines traditional and modern services, like retail and wholesale trade,transport, hotels and restaurants, government services, business and banking services, telecommunications , ITC and tourism. Due to its relative importance manufacturing is often shown separately from industries.
The value added per economic sector as a share of GDP changed remarkably little during the last two decades, at least in current USD.
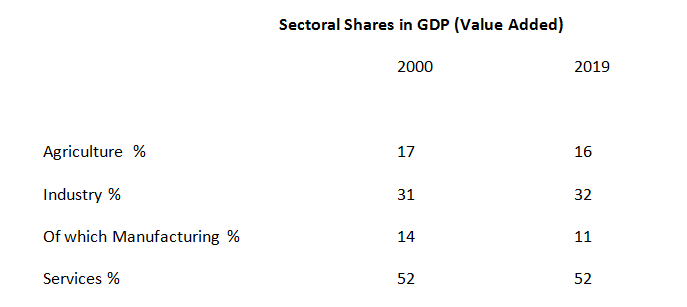

Only manufacturing showed a relative decline as share in GDP, but what this means is that its growth lagged behind that of the other sectors, also that of mining within industries. The other two major sectors averaged 5% growth, just as GDP’s, so as to retain its share. Agriculture ‘s 4.6% inflation-adjusted annual mean increases in growth between 2000 and 2016 is roughly double that of the prior three decades, and higher than that of other regions in the World (Jayne 2018). So what we are NOT seeing is rapid industrialisation, a key aspect of modernization in other regions in the past, but a continuing dominance of agriculture and services[6].
Again, there are vast differences between countries. A high contribution of agriculture to GDP reflects a limited diversification of the economy, and is mostly found in the poorest countries. Fourteen countries still have a VA for agriculture over 30% of GDP: Chad and Sierra Leone 60%; CAR, Guinea Bissau, Mali, Niger and Burundi 40%,; and Kenya, Ethiopia, Rwanda, Burkina Faso and Liberia in between 30-40%. Very low shares are to be found in Southern Africa and some oil producers, below 10%. A higher than average agricultural growth (than the 4.6% mentioned before for2000-2016) was to be found in Ethiopia and Nigeria (6%), Mali, Rwanda, Sierra Leone and Mozambique (5%). At least 30 countries had an agricultural growth higher than its population growth, and registered positive growth per cultivated hectare and per agricultural worker. With 31 countries still importing more agricultual produce than exporting, an average export-import ratio of 0.7, a few countries , such as Cote d’Ivoire, Malawi, Guinea Bissau, Tanzania and Uganda, export large surpluses (AGRA).
In the meantime, at least eight countries show signs of a Green Revolution, with cereal yields up 40-70 kg/ha/year for more than 15 years now, in Ivory Coast, Rwanda, Malawi and Mauritania; and at least an average 70 kg/ha/year for a similar period in South Africa, Zambia, Madagascar and Ethiopia (Breman). If we include those countries where yields increased by 20-40 kg/ha/year, then ¾ of Africans live in countries with increasing yields. Fertilzer appears to be a key component in this success, coupled with other measures to overcome the continent’s soil infertility constraints.
On average, Africa’s industrial sector today is a rather constant percentage of total economic output. But some “de-industrialization” took place in several countries, mainly in Southern Africa. This happened along three important metrics: size, diversity and sophistication. Resource-rich countries have a high share of industries in GDP, such as Angola (60%) and DRC (45%), as this includes mining. Below average are those countries were the agricultural sector is still dominant.
The share of manufacturing in GDP declined from 14 to 11% over the period under review, as its growth was 3,5% p.a. , not bad compared to other regions, but lower than that in the other sectors. Still, manufacturing production has nearly doubled since 2000,from $85 billion in 2000 to more than $160billion in 2015 (in constant 2010 prices) (SET/ODI ). And manufacturing exports increased by over 7% since 2000, especially transport vehicles, appliances, electronics and industrial equipment. Foreign direct investment (FDI) in the sector also increased, but largely limited to a few countries: South Africa, Nigeria, and less so Angola, Kenya, DRC, Ivory Coast, Ghana and Zambia. Manufacturing in most of these countries is the production of equipment and other industrial inputs necessary to support mining. But there are a growing number of successful industrial markets that are not directly related to extraction, such as leather in Ethiopia, garments in Lesotho, automobiles in South Africa, and pharmaceuticals in East Africa. In general, food and beverages is the dominant manufacturing sector in Africa,followed by textiles and clothing. The largest manufacturing bases (in absolute terms) can still be found in Nigeria and South Africa, followed by Kenya, Democratic Republic of Congo, Côte d’Ivoire, Ethiopia and Tanzania.But in terms of growth, some countries, including Ethiopia, Rwanda and Tanzania registered growth rates of close to 10% , albeit from low bases. Continuing rapid industrial growth is to be expected in Angola, Kenya, Ghana, Tanzania, Zambia, Ethiopia and Mozambique (Signé).
A high share of the services sector in GDP is a characteristic of rich countries, e.g. over 70% in USA and Netherlands. In Africa this is the same, as in South Africa, Botswana, Seychelles, Cabo Verde and Mauritius. Remarkably growing services are the financial and banking services industries of Mauritius and Nigeria, the commercial and cargo air transport industry in Ethiopia and South Africa, the educational services industries of Uganda and Ghana and the port services industries of Djibouti and Kenya. Where agriculture is still dominant, services share in GDP is low, below 40%, such as in Rwanda, Sierra Leone, Chad and Madagascar.
Overall growth in the services sector was at least 5% during the last two decades, and more than 6% in recent years, especially in East-Africa. Apart from modern business and financial services, IT and tourism, this was due to more traditional services, like wholesale and retail trade, hotels and restaurants and transport. Many of the latter are in the informal sector, which produces still 50-80% of GDP in most countries.
Employment
The change in sectoral employment shares gives a better picture of structural change in Africa during 2000-2020 than the changes in value added shown before.


Source: Mensah et al, 2018; they use an expanded data base for 18 African countries, representing 80% of GDP.
It is clear that there is an ongoing shift of labour from agriculture to other sectors, mainly (traditional) services, and not much to industries (incl. manufacturing). Especially rural female workers over 25 years seem to move out from agriculture. In other sources this shift is even larger (Jayne, Agra). But relative productivity in agriculture has not changed and remains very low, as the next table shows. Relative productivity is measured as the ratio of each sector’s labour productivity (output/value added per worker) to labour productivity in the total economy.
Relative Productivity
2000 2015
Agriculture 0.4 0.4
Industries 8 6
Manufacturing 3 2.5
Services 4 3
Source: Mensah et al 2018
A relative productivity of 0.4 for agriculture means that (labour) productivity there is only 40% of the average productivity in the whole economy. For the whole of industries (includes mining) productivity is six times the average, for manufacturing 2.5 and for services three times. Therefore a shift of labour from agriculture to the other sectors is fundamental for development, so-called structural change, to make labour (much) more productive. Thus far this happened only to a limited extent in Africa, from agriculture to services. But not in line with the classical development model, whereby a rapid shift occurs from agriculture to a much more productive manufacturing. Unfortunately, the move to services mainly takes place towards trade/hotels/restaurants, a largely informal sector which productivity is close to the average of the economy. The same applies to petty manufacturing (carpentry a.o.), which also saw some labour increase. Still this is more than twice the productivity in agriculure.
With almost 60% of labour still in agriculture, and quite some subsistence farming,this depresses overall productivity in the economy to a large extent, as agriculture remains very labour intensive. But it should not be forgotten that there is much underemployment in agriculture, so that if hours worked are taken into account, the gaps in productivity between sectors are reduced. Moreover, rural labour is often active in various sectors.
Average annual labour productivity growth in Africa was 2.7% since 2000, much higher than before, but still lower than Asia. The African average is biased by the weight of the very populous countries Nigeria and Ethiopia, which recorded a growh of 5% in that period (Mensah et al, 2018). Almost half of that 2.7% growth was due to productivity growth within each sector, and half to structural change, i.e. a shift of labour from agriculture to industries and services. When agricultural productivity increases, labour can be released to other sectors. Formal employment laws restrict such movements, often to protect labour, but with 70% of all labour active in the informal sector such laws hardly apply (World Bank, 2020).
East-Africa saw more structural change than the rest, but the top growers are somewhat spread over the continent. Ethiopia, Rwanda, Tanzania, Mozambique, Nigeria and Ghana , all achieved an average (labour) productivity growth of over 5% p.a. during the period 2000-2015, with the rest remaining below 1.5%. In Rwanda and Tanzania almost all growth was through structural change, in Ethiopia and Nigeria this was a mix of both inter- and intra-sectoral growth, and in Ghana and Mozambique this was entirely due to productivity growth within each sector.
Unfortunately for the exporters of international commodities, their labour productivity did not increase much more after the global financial crisis of 2009, which saw the prices of their exports decline. As a result of this, average labour productivity on the continent declined somewhat after 2015, below the 2.7% average over the period before (World Bank 2020).
Overall there is clearly some structural change in Africa, but not yet enough and not much in a desired direction. Job creation in modern manufacturing and services is limited, also because of skill requirements. An agricultural revolution remains necessary, and also a shift within services to more productive ones, like finance and ICT. But at least overal labour productivity – the key development indicator – is moving in the right direction, especially in some countries.
Successful countries
The following table brings together major trends discussed before, and shows the 20 most successful countries over the last two decades. The following five indicators are used: labour productivity of at least 5% p.a. (source: Mensah et al), rapid economic growth and good poverty reduction (source: UN-WIDER), the fastest poverty reduction (source: World Bank 2019), rapid industrialisation(source: Signé) and a green revolution in agriculture (source: Breman)
Successful countries and Indicators
| Labour productivity | Growth and poverty reduction | Fastest poverty reduction | Rapid industrialisation | Agricultural revolution | |
| Ethiopia | X | X | X | X | X |
| Rwanda | X | X | X | X | |
| Ghana | X | X | X | ||
| Tanzania | X | X | X | ||
| Mozambique | X | X | |||
| Nigeria | X | X | |||
| Malawi | X | X | |||
| Uganda | X | ||||
| Chad | X | ||||
| Congo | X | ||||
| Burkina faso | X | ||||
| DRC | X | ||||
| Namibia | X | ||||
| Angola | X | ||||
| Kenya | X | ||||
| Zambia | X | X | |||
| South Africa | X | X | |||
| Madagascar | X | ||||
| Mauritania | X | ||||
| Cote d’ Ivoire | X |
This list shows the best performing countries in Africa since the year 2000, with a number of relevant indicators that cover most aspects of economic development. Not all indicators cover the full two decades. There is some overlap in indicators, as each one is related to some aspect of economic growth, either productivty, inclusiveness (poverty), and sectoral growth (industry or agriculture). As there is little doubt that a high growth of the labour productivity is a key determinant for the long term success of a country, the first six positions for countries in this table seem justified. As Ethiopia scores high on all indicators, its top position is evident. Rwanda also performs very well, as it also had high industrial growth, but not so much (purely) industry-driven economic growth (and therefore not included in Signé ’s list). Ghana and Tanzania are also amongst the top performers, whilst most of the others only do well on one of the indicators. Only Malawi, Zambia and South Africa did well on two indicators.
It is probaly not possible to fully explain why some countries are doing better than others. Usually this involves a mix of reasons, historical, geographical and political, whose interconnectedness is a combination of conscious eforts and good luck. Ethiopia and Rwanda share a horrible recent past, respectively brutal communism and genocide, which heavily influenced its recent effors at succes. Moreover, Ethiopia is a rather un-African country, geographicaly, historically and culturally.Both countries followed a home-grown path, without natural resources, whereas Ghana, Tanzania and Mozambique have ample of those resources, oil, gas and/or minerals. But still something can be said about possible success factors.
Succes Factors
Politics is probably THE outstanding success factor.Where there is a will, there usually is a way. Ethiopia and Rwanda demonstrate this, two authoritarian regimes driven by much political will right from the top. Developmental states with heavy public investment, in infrastructure and institutions, and policies geared towards a simultaneous agricultural and industrial revolution. The desire to reduce poverty rapidly is reflected in sound macro-economic management, budget and balance of payments stability, improved governance and limited corruption and attracting foreign aid and foreign investment (in industries) and focussing on small-scale agricultural development.
Ghana shows that a democracy can also achieve good results, and to a lesser extent also Tanzania, Moambique and Nigeria. But democracy is not a must and can at times destabilise a poor country (Collier). Ghana also shows that natural resources (oil) do not have to be a curse, leading to a neglect of other sectors, as seen in many other African countries.
Agricultural growth is good for poverty reduction, as the five fastest growers with rapid poverty reduction show (WIDER,World Bank 2007). But the evidence is not conclusive, as population-driven growth in the informal non-farm economy should also be taken into account (Jayne). But it is no coincidence that Ethiopia and Rwanda are amongst the top (four) performers within the CAADP/NEPAD framework, with commitments set out again in the Malabo declaration of 2014. And Ghana – a democracy – is now also getting on track with its targets, the most important one being spending more than 10% of government budget on agriculture (AGRA). Amongst its priorities are a research extension system focusing on a few profitable and practicable innovations, ensuring a supply push of fertilizer at a high growth rate and on improved seed varieties, and on providing finance attuned to the special needs of the small-scale commercial farmer. Ethiopia managed to build a very intensive extension system with almost 50 agents per 10.000 farmers, compared to four in Tanzania, three in Nigeria and 16 in China. It has 15.000 farmer training centres, and an Agricultural Transformation Agency (like Rwanda) to further boost yields. Moreover, it invested heavily in rural infrastructure (roads, health and education) and access to markets and industries rather than short-term subsidies (as in Malawi). All these measures are geared towards upgrading the productive capabilities of small-scale farmers, who often are key players in succesful development programmes elsewhere too[7].
Elsewhere in Africa there are also remarkable changes in its agri-food systems and a transformation through rapid urbanisation, diet changes, and farm productivity growth in a number of countries. This led to an 800 per cent increase in the volumes and value of food marketed through rural-to-urban value chains since 2000 (Jayne).
The dominance of old (female) farmers needs to be overcome for technology changes, and bringing back youth in the picture also seems necessary to seriously tackle their unemployment. Ethiopia’s Productive Safety Net Programme (since 2006), partly funded from foreign aid, provides cash or food to poor households, linked to rural public works in the lean season. This way land gets rehabilitated, water sources improved and hospitals and schools constructed. In doing so it has reduced soil loss by almost 40%, reduced the damage from seasonal flooding and droughts, and improved land productivity by up to 400% (Mellor). Heavy public investment in rural infrastructure (land, water, roads, schools, education, research) also boosts agriculture in other success countries, and opening up rural areas and people to the rest of the world. Elsewhere, rural public works also contributed to agricultural development.
Industrial development is also necessary and possible, as shown by the succesful countries, even when faced with great challenges such as relatively unskilled and inefficient labour, high wage costs, high transport costs, lack of access to global value chains, supply chain constraints, and high costs of doing business. Focusing on agro-processing, presently only good for 20% of agriculture’s value added, is a good way to develop agriculture and industries at the same time, creating a market for farm produce. Ethiopia tries to establish a manufacturing sector to complement and follow the growth of the dominant agriculture sector by focusing on labour-intensive and relatively low-tech manufacturing activities with strong backward linkages to agriculture (e.g. textiles, leather and leather products) and agro-processing. Low industrial wages (below $ 100 per month) make this also possible, and competitive compared to Asia. Ethiopia is the only African country to have the goal of rapid agricultural growth central both to its long-term vision for the country as well as its strategy: Agricultural Development Led Industrialization. Adopting a value chain approach would also imply identifying, producing, and processing commodities in which Africa has a comparative advantage, such as cocoa, oil palm, cassava, cashew, rubber, and sugar cane, and whose processing tends to be labor-intensive.Africa’s low-cost labor would give African producers an edge (ACET).
Africa will not necessarily follow Asia’s example of export-led industrial growth, but maybe more with a focus on the domestic market (Diao and McMillan; Frankema). A growing middleclass provides an interesting market everywhere. A conducive investment climate, government commitment and infrastrucure development help to attract a lot of foreign investment for manufacturing, as Ethiopia (much from China) and other East-African countries have shown. Pro-active targeting of foreign investors through a range of incentives (e.g. favourable land lease rates, access to commercial credit, free imports of inputs, generous tax breaks) helps to guide investments in the right directions (SET). The newly established free-trade zone in Africa (CFTA) will provide more export opportunities within the continent. Thirty-three countries are now participating in this promising scheme, whereby efforts are needed to let not only the large exporting nations benefit.
Investment as a share of GDP is higher in the succesful countries than the average of 23% for Africa, with even 45% for Mozambique and 35% for Ethiopia. Much of this is public investment. Apart from foreign private investment in manufacturing much is of course in natural resources (oil, gas and minerals), unfortunately often accompanied by a lot of corruption causing millions of dollars annually not to be devoted to development(Burgis). Large companies often also exaggerate their prices (and profits) in weak economies. Investment in infrastructure, often by China, boosts economic growth, such as the large Nile-dam for power generation in Ethiopia (self-financed).
Succesful countries also attracted much foreign aid, Ethiopia around $40 per capita- much from USA, China and Turkey, but Rwanda and Mozambique both got 2-3 times more (Priewe). Where governments are serious about development, aid effectivess obviously is highest.
South Africa is a special case, not further explored here. It is already industrialized but its economy is rather stagnating, thereby depressing Africa’s average score. Other African countries could follow Ethiopia’s example, by keeping wages low and increasing productivity. This way a large(r) part of the 80 million industrial jobs that China is exporting, because of rising labour cost, could be captured.
Labour productivity is the KEY to development, or as the American economist Paul Krugman once said (in 1990): Productivity isn’t everything, but in the long run it is almost everything. Its growth determines how much (productive) use can be made of existing supply of labour and capital for economic growth. Its increase is driven by innovation (technology) and by investment in physical and human capital. A conducive private sector environment is necessary for this, such as market structures, infrastructure, the institutional framework, and the quality of governance (World Bank 2020). Rwanda is a good example where productivity growth was boosted by continued reforms to strengthen institutions and governance, upgrade infrastructure, increase access to education, and improve the business environment to attract private investment. Adverse shocks—such as natural disasters, epidemics, wars, and financial crises—weaken this productivity growth, as so often in Africa.
Productivity can grow within sectors, but more so through a shift from labour from the less productive agriculture to the more productive industries and services sectors. To some extent such structural change is already happening, but not yet enough. Since 2000 the share of the labour force primarily engaged in small-scale farming has been declining from 70-80% to 40-65%, and this the more so where agricultural productivity grew fastest (Jayne). But much of this labour shifted to the not so productive services like trade and other informal jobs. High levels of informality—around 40 percent of official GDP and 90 percent of total employment—may inhibit faster productivity growth, as productivity among informal firms are only one-seventh of formal ones (World Bank 2020). Therefore it pays to formalize businesses, by facilitating licensing, lowering registration cost and improving the business environment.
It is no coincidence that the six countries with the highest labour productivity growth (over 5% p.a.) are also industrializing, bringing the largest gains in productivity. It is no wonder that a simultaneous agricutural and industrial revolution is so powerful, as it pushes labour out of agriculture and pulling it into manufacturing at the sametime. But earlier we saw that successful development path may differ: in Ghana and Mozambique this growth was largely due to intra-sectoral growth, in Rwanda and Tanzania this was due to structural change (between sectors) , and in Ethiopia and Nigeria through a mix of both (Mensah et. al). So both roads are open. But at least labour is shifting from agriculture to industries. Only Ethiopia and Rwanda combined this with rapid agricultural growth. But even those two still have a high youth unemployment, around 25%, and this remains a time bomb under the social structure (Mihyo et al). Apart from large scale manufacturing a lot of small and micro enterprises need to be created at the grassroot level, preferably formal ones, also for employment reasons. Just as in agriculture, small producers are important for industrial growth as well (Diao and McMillan).
Finally, modern services need to be boosted, e.g. through the many tech hubs that have sprung up across the continent, like in Lagos, Nairobi and Cape Town. At a recent meeting of the World Economic Forum at least 400 hubs were identified, technology centers promoting thousands of startups with all the necessary facilities. Low-skill biased digital technology may also enhance productivity in the informal sector. But a long term threat to labour and productivity (in manufacturing) comes from increased automation and robotization. More diversification will reduce such economic risks.
Final Remarks
The year 2020 was a bad year for Africa, due to the corona crisis, and 2021 may not turn out much better. For the first time in over two decades the continent’s GDP shrank, by over 3%, and that of some oil exporters by even more. Poverty is likely to increase by more than 10%, an extra 40 million people, and many people may loose their job. A health crisis – and very slow vaccination – may be followed by a financial one, as poor countries do not have such easy access to cheap money as the rich ones do. Over half of the low-income countries in Africa will be in debt distress. Its two power houses, Nigeria and South Africa, generating over 40% of its total GDP, will also be in depression. It will take several years before GDP p.c. is back at the pre-covid level (Economist).
But not all is bad news. Incidence of covid-19 in tropical Africa seems to be less than elsewhere, probably because of a very young population, high temperatures, some immunity built up from other diseases like malaria, and a quick response by many governments (lockdown, curfew). Moreover,six of the only ten nations worldwide that maintained a positive economic growth rate during 2020 are in Africa. Not surprisingly, these include our success stories Ethiopia, Rwanda and Ghana, thanks to their relatively diversified economy.But this does not mean that certain sectors and people did not suffer, like tourism and trade, without any government support. And political and social unrest in Ethiopia demonstrate the vulnerability of its democratisation process. Even an economic miracle is no guarantee for wellbeing. The corona crisis may contribute to shorter supply chains, more government involvement in the economy and less openess in international trade. But poverty reduction cannot be stopped in Africa, the tools are there to do so, it is only a matter of time. With enough political will policies can be designed and implemented to create the necessary agricultural and industrial revolution within a context of good governance and little corruption. And just like in Asia before, good policies seem to becontageous in East-Africa, with neighbours eager to follow the example of Ethiopia and Rwanda. Foreign aid can contribute to the process by helping those who help themselves, and may be increased to get over the corona crisis more quickly.
References
ACET, African Transformation Report, 2017, Agriculture Powering African Economic Transition
ADB Outlook 2020
AGRA, 2018, Africa Agriculture Status Report
Bol D, 2014, Het Wonder van Afrika
Breman H et al, 2019, From Fed by the World to Food Security, Accelerating Agricultural Development in Africa
Burgis T, 2016, The Looting Machine
Collier P, 2011,Wars, Guns and Votes, Democracy in dangerous places
Diao Xinshen and M. McMillan, 2018, Toward an understanding of economic growth in Africa; World Development
Economist the, February 6, 2021
Frankema E and M van Wayenburg, 2018,Africa Rising, a historical perspective; African Affairs, Vol. 117, Oct. 2018, Pages 543–568
Jayne T.S. et al, 2018, Africa’’ s Unfolding Economic Transformation, Journal of Development Studies
McKinsey, 2010, Lions on the Move
Mellor J.W. and Sohail Malik, 2017, Ethiopia: An African Land Productivity Success Story
Mensah E.B., S.Owusu, N. Foster-McGregor and A. Szirmai, Structural change, productivity growth and labourmarket turbulencein Africa; UN university, Maastricht, 2018.
Mihyo P (editor) et al, 2015,Urban Youth Unempl in Eastern and Southern Africa
Milanovic B, 2016, Global Inequality
Priewe J, 2019, Ethiopia’s High Growth and Its Challenges–Causes and Prospects
SET/ODI, 2018, Manufacturing in Africa, factors for success
Signé L., 2018, The potential of manufacturing and industrialisation In Africa; Brookings Institution
Smil V., 2020, Growth
Unctad, 2020, Handbook of Statistics
WIDER,UN, 2018, Growth and Poverty
World Bank, 2007, Agriculture for Development
World Bank, 2018, Poverty and Shared Prosperity
World Bank, 2020, Global Productivity , Trends , Drivers and Policies
World Bank, 2020a, Ethiopia: Harnessing continued growth for accelerated poverty reduction
[1] Apart from statistical errors and guesswork, claims are sometimes expressed about political interference in official figures by the authorities, to make them look niicer (which happened to Rwanda and Tanzania recently).
[2] Purchasing power differences matter as the African GDP p.c. in 2019 of $1600 (in current dollars) becomes $ 3700 if corrected for purchasing power differences (expressed in current international PPP dollars) between countries
[3] Of course this figure in real terms, i.e. corrected for inflation, is more relevant than the changes indicated in the uncorrected p.c. GDP in current USD in the first table befofe, from USD 600 to 1600.
[4] That poverty line measures consumption and is expressed in (international) dollars that are corrected for inflation and purchasing power differences (PPP 2011).
[5] Smil summarizes criticism of GDP, a.o. a neglect of cost of environmental degradation and global warming, but sees no better alternatives (Smil, 2020).
[6] For comparison: average sectoral change for the seven largest Asian economies during their period of take-off, 1970-90, in terms of value added as % of GDP, was: agriculture from 34 to 19%, industries from 27 to 38% and services from 39 to 43%; Dutta M. The Asian Economy and Asian Money.
[7] A group of former (Dutch) experts in agriculture in Africa also stressed the importance of small farmers for agriculutural take-off; for a summary of their conclusions, see De Vork, march 2020; for their individual evaluations see Mutsaers H. and P. Kleene (eds) , 2012, What is the Matter with African Agricutture?. Some members provided useful comments to me.
